Visualizations How To
Create a New Visualization
Once your query has finished running for the first time, you can add a visualization for your results by clicking the “New Visualization” button above the results (currently shown only when the source code is shown).
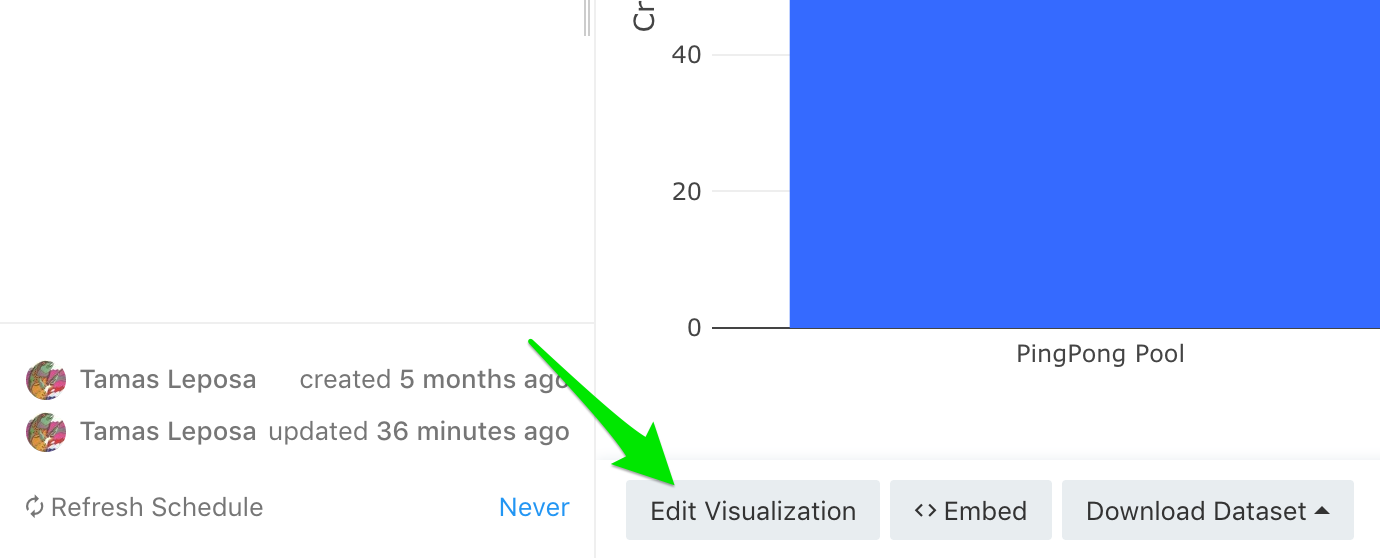
Edit A Visualization
To change an existing widget's parameters, enter the query of that widget (just click its title). Then, view the source code and you'll see an "Edit" option under each visualization, clicking it will open the current settings for that visualization (type, x, y, group...).
Hit "Save" to apply your changes or "Cancel" to leave no trace.
Embedding Visualizations
For any visualization you create in PayCore.Analytics, you can get an embed link:
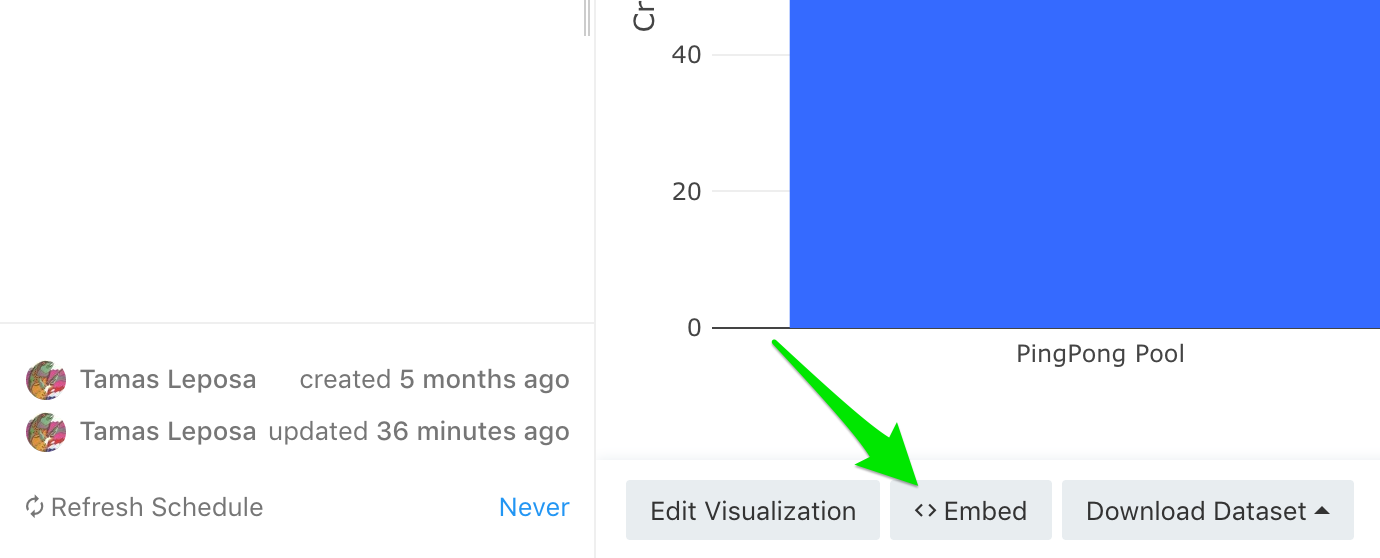
Click the "Embed" button to view the <iframe> code you need to copy or a link to the image you can place anywhere.
Queries with parameters do not support embeds at the moment.
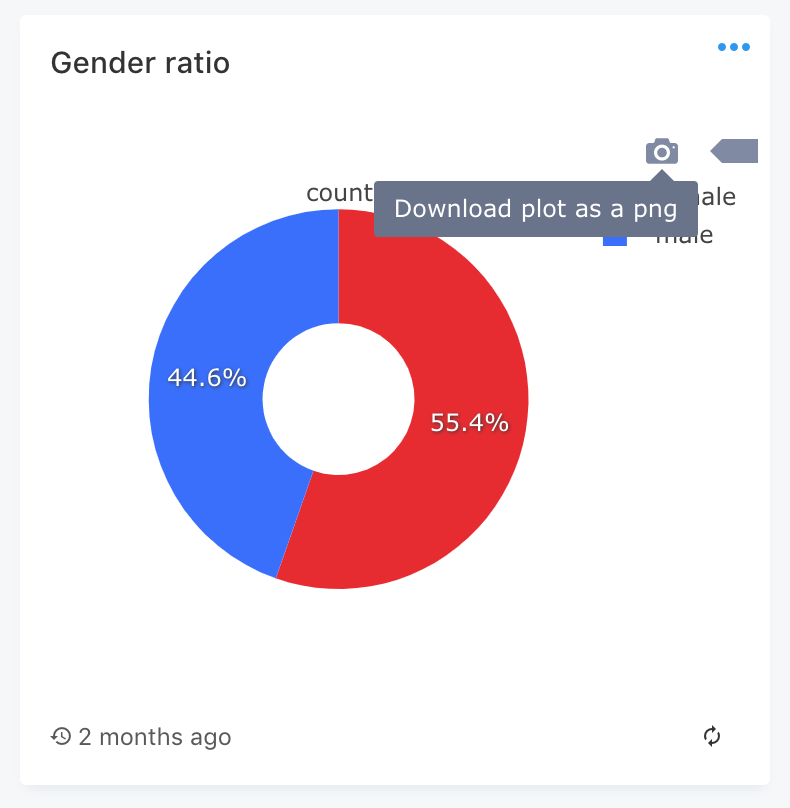
Downloading A Visualization as an Image File
To download a chart visualization as an image file go ahead and hover over the top right area of the visualization and click the camera icon. It will be downloaded to your device.
Visualization Types
PayCore.Analytics supports several different types of visualizations - A Table is the default view.
Boxplot
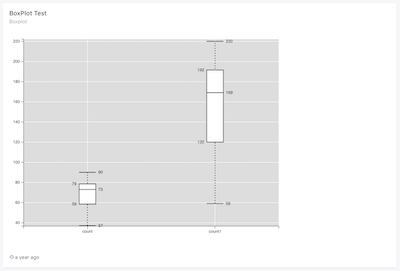
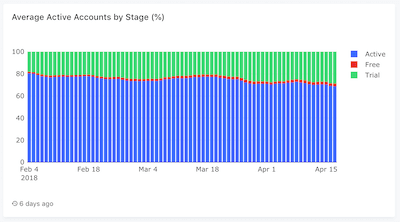
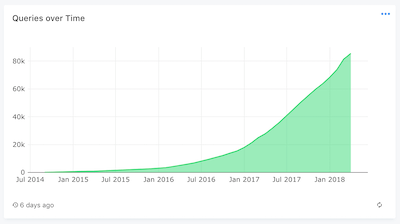
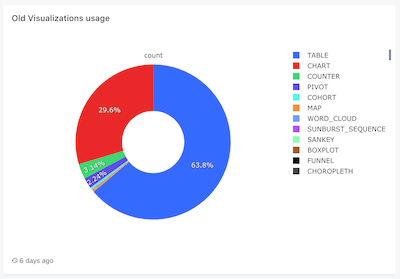
Chart - Line, Bar, Area, Pie, Scatter
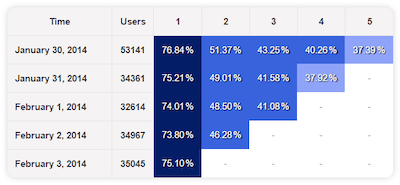
Cohort
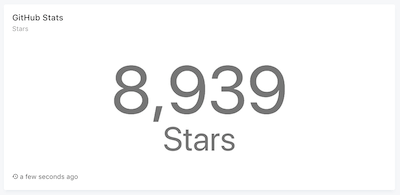
Counter
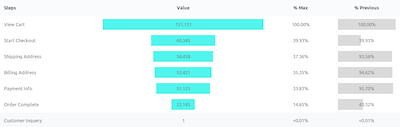
Funnel
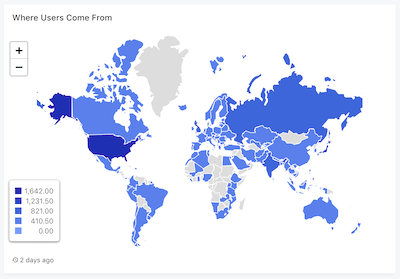
Map
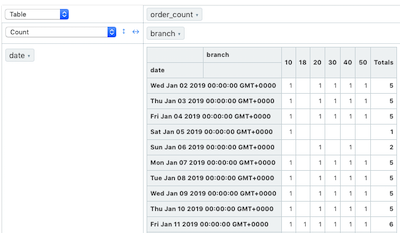
Pivot Table
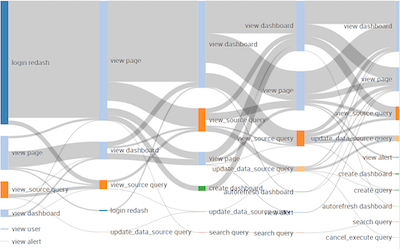
Sankey
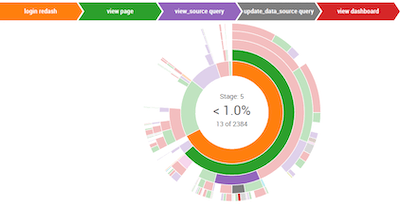
Sunburst
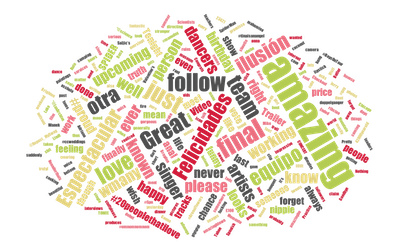
Word Cloud