Creating and Editing Dashboards
Creating a Dashboard
A dashboard lets you combine visualizations and text boxes that provide context with your data.
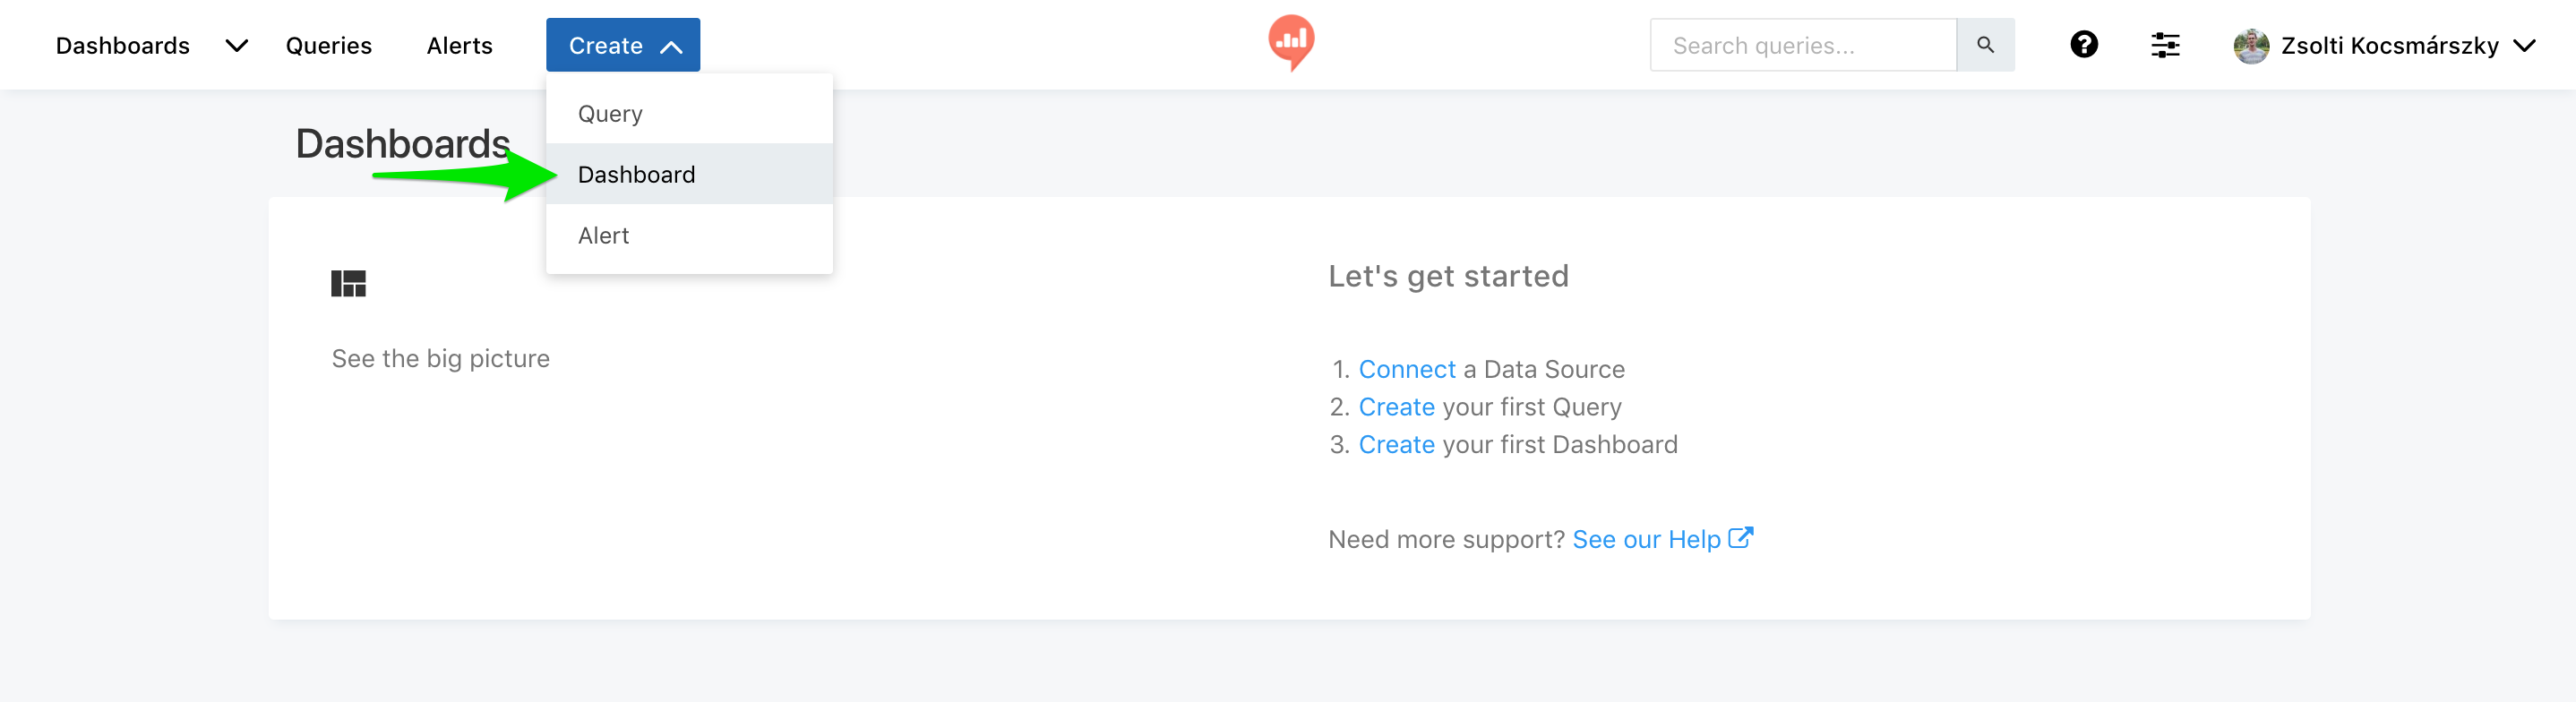
You can create a new dashboard with the Create button from the main navigation menu:
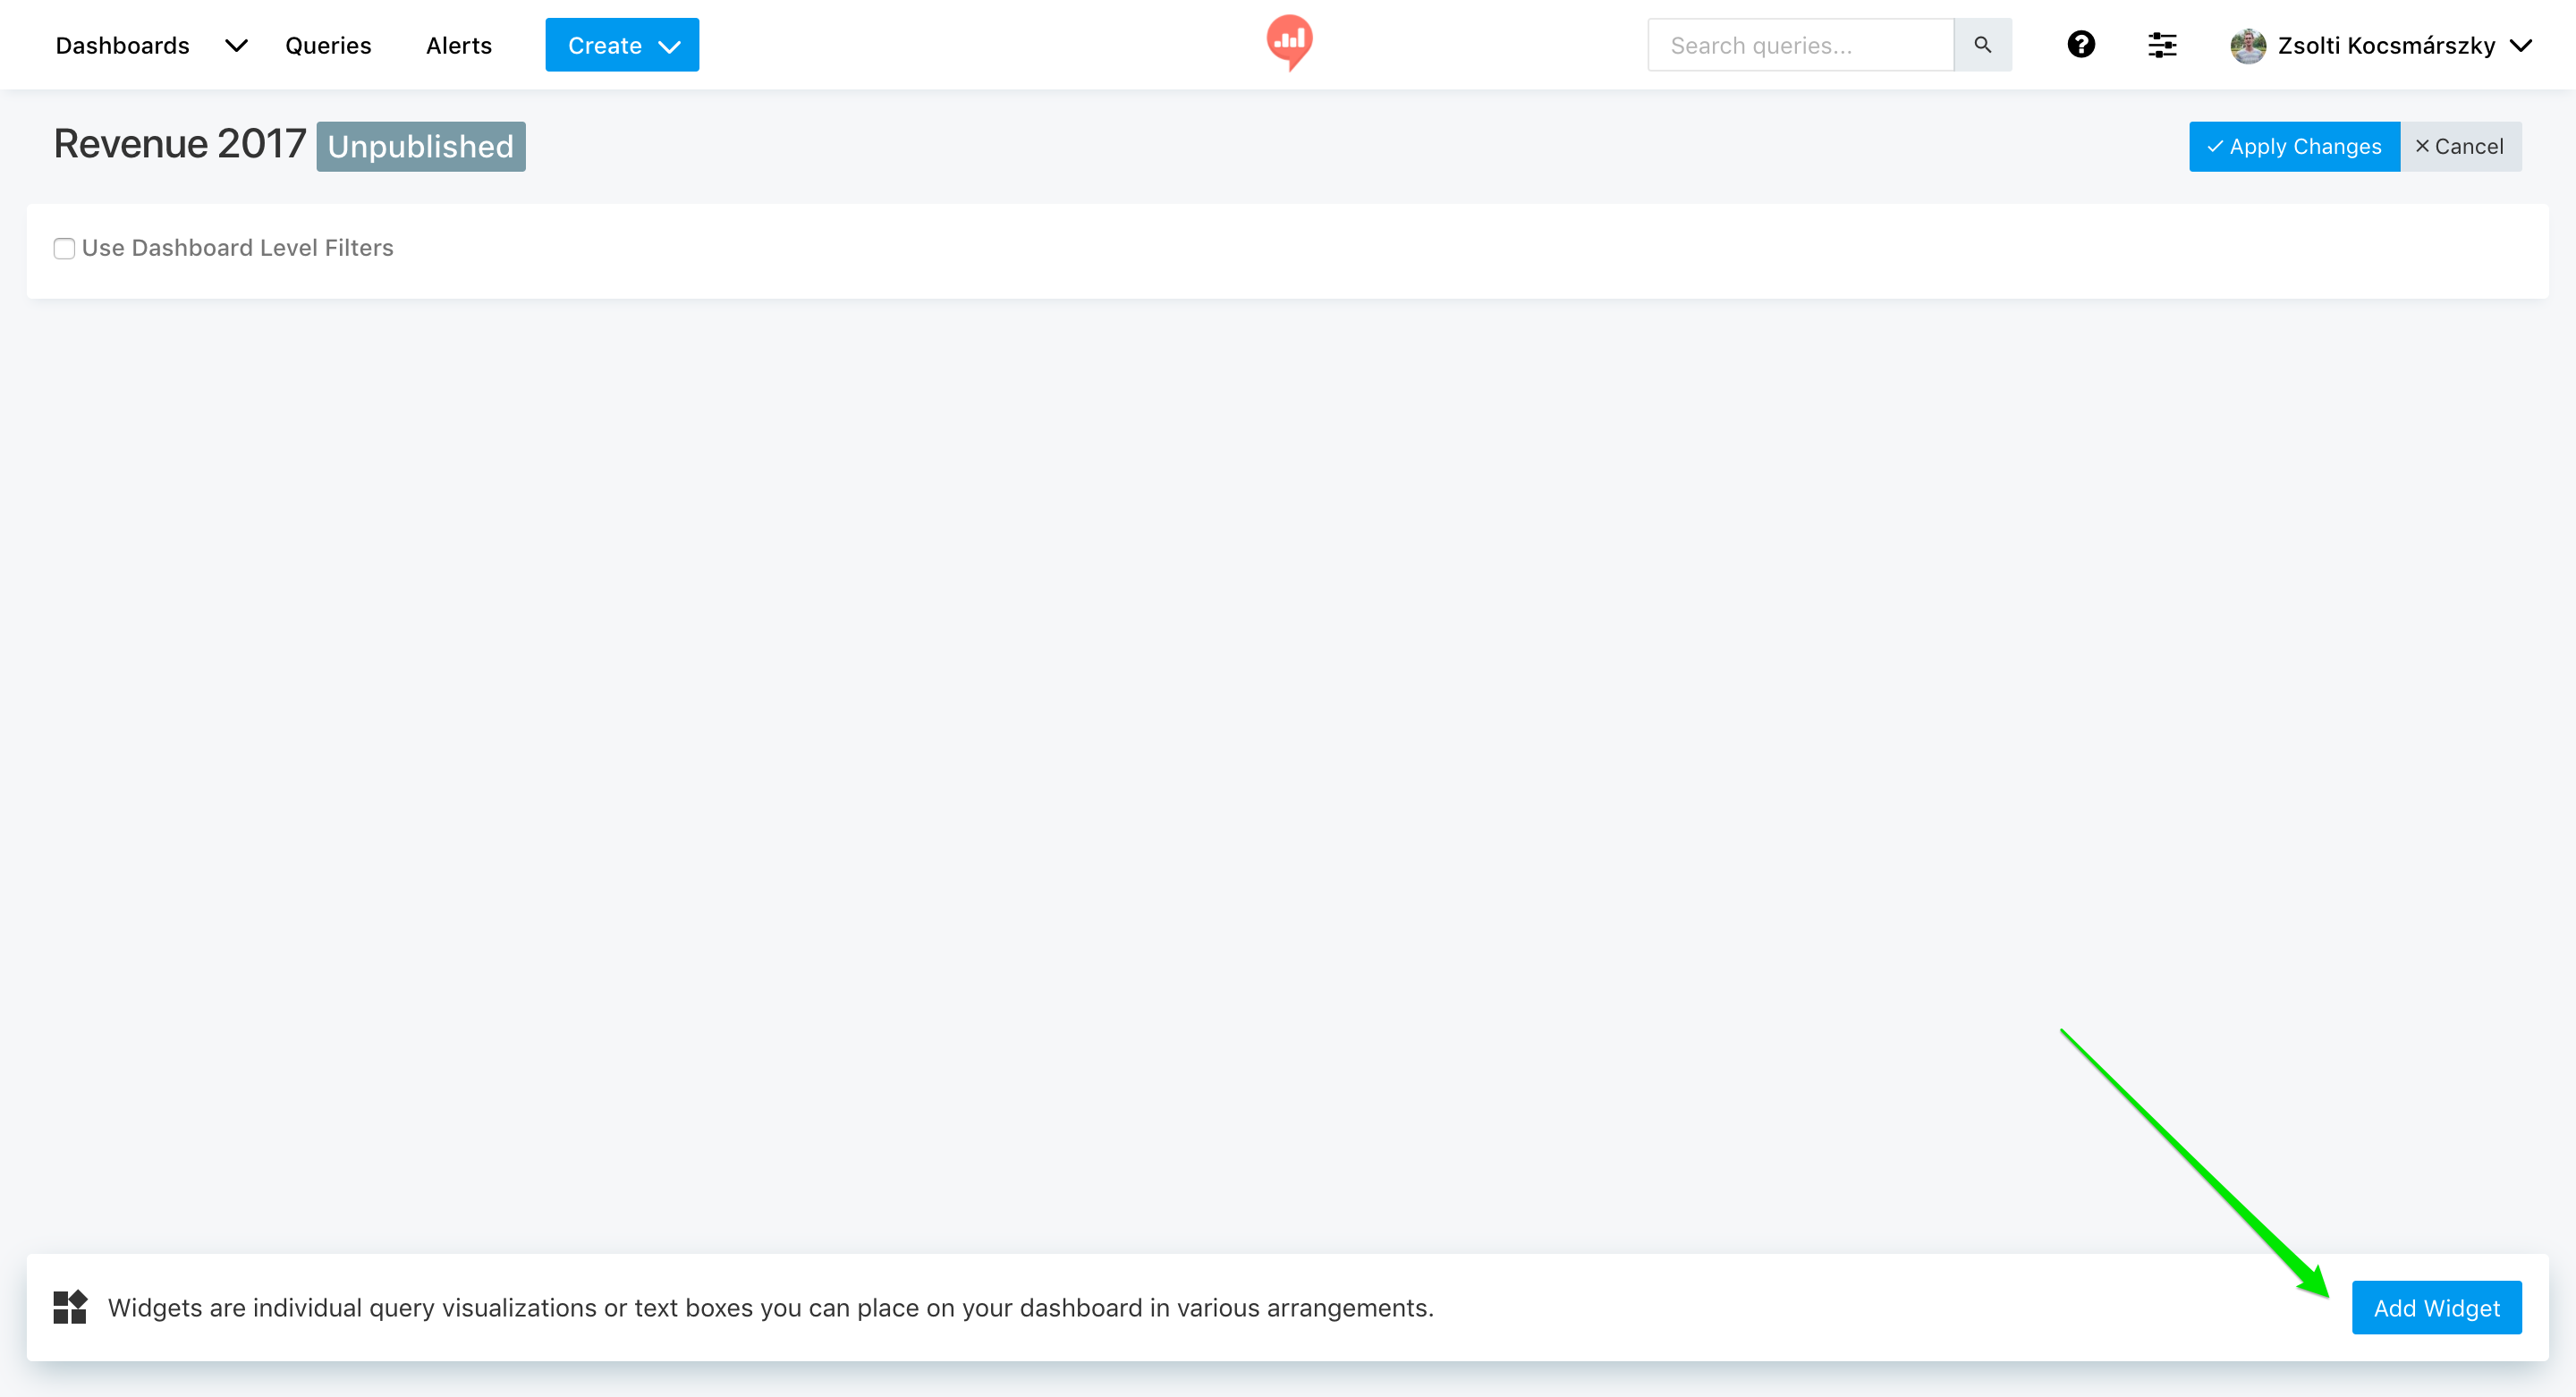
After naming your dashboard, you can add widgets from existing query visualizations or by writing commentary with a text box. Start by clicking the Add Widget button.
Search existing queries or pick a recent one from the pre-populated list:
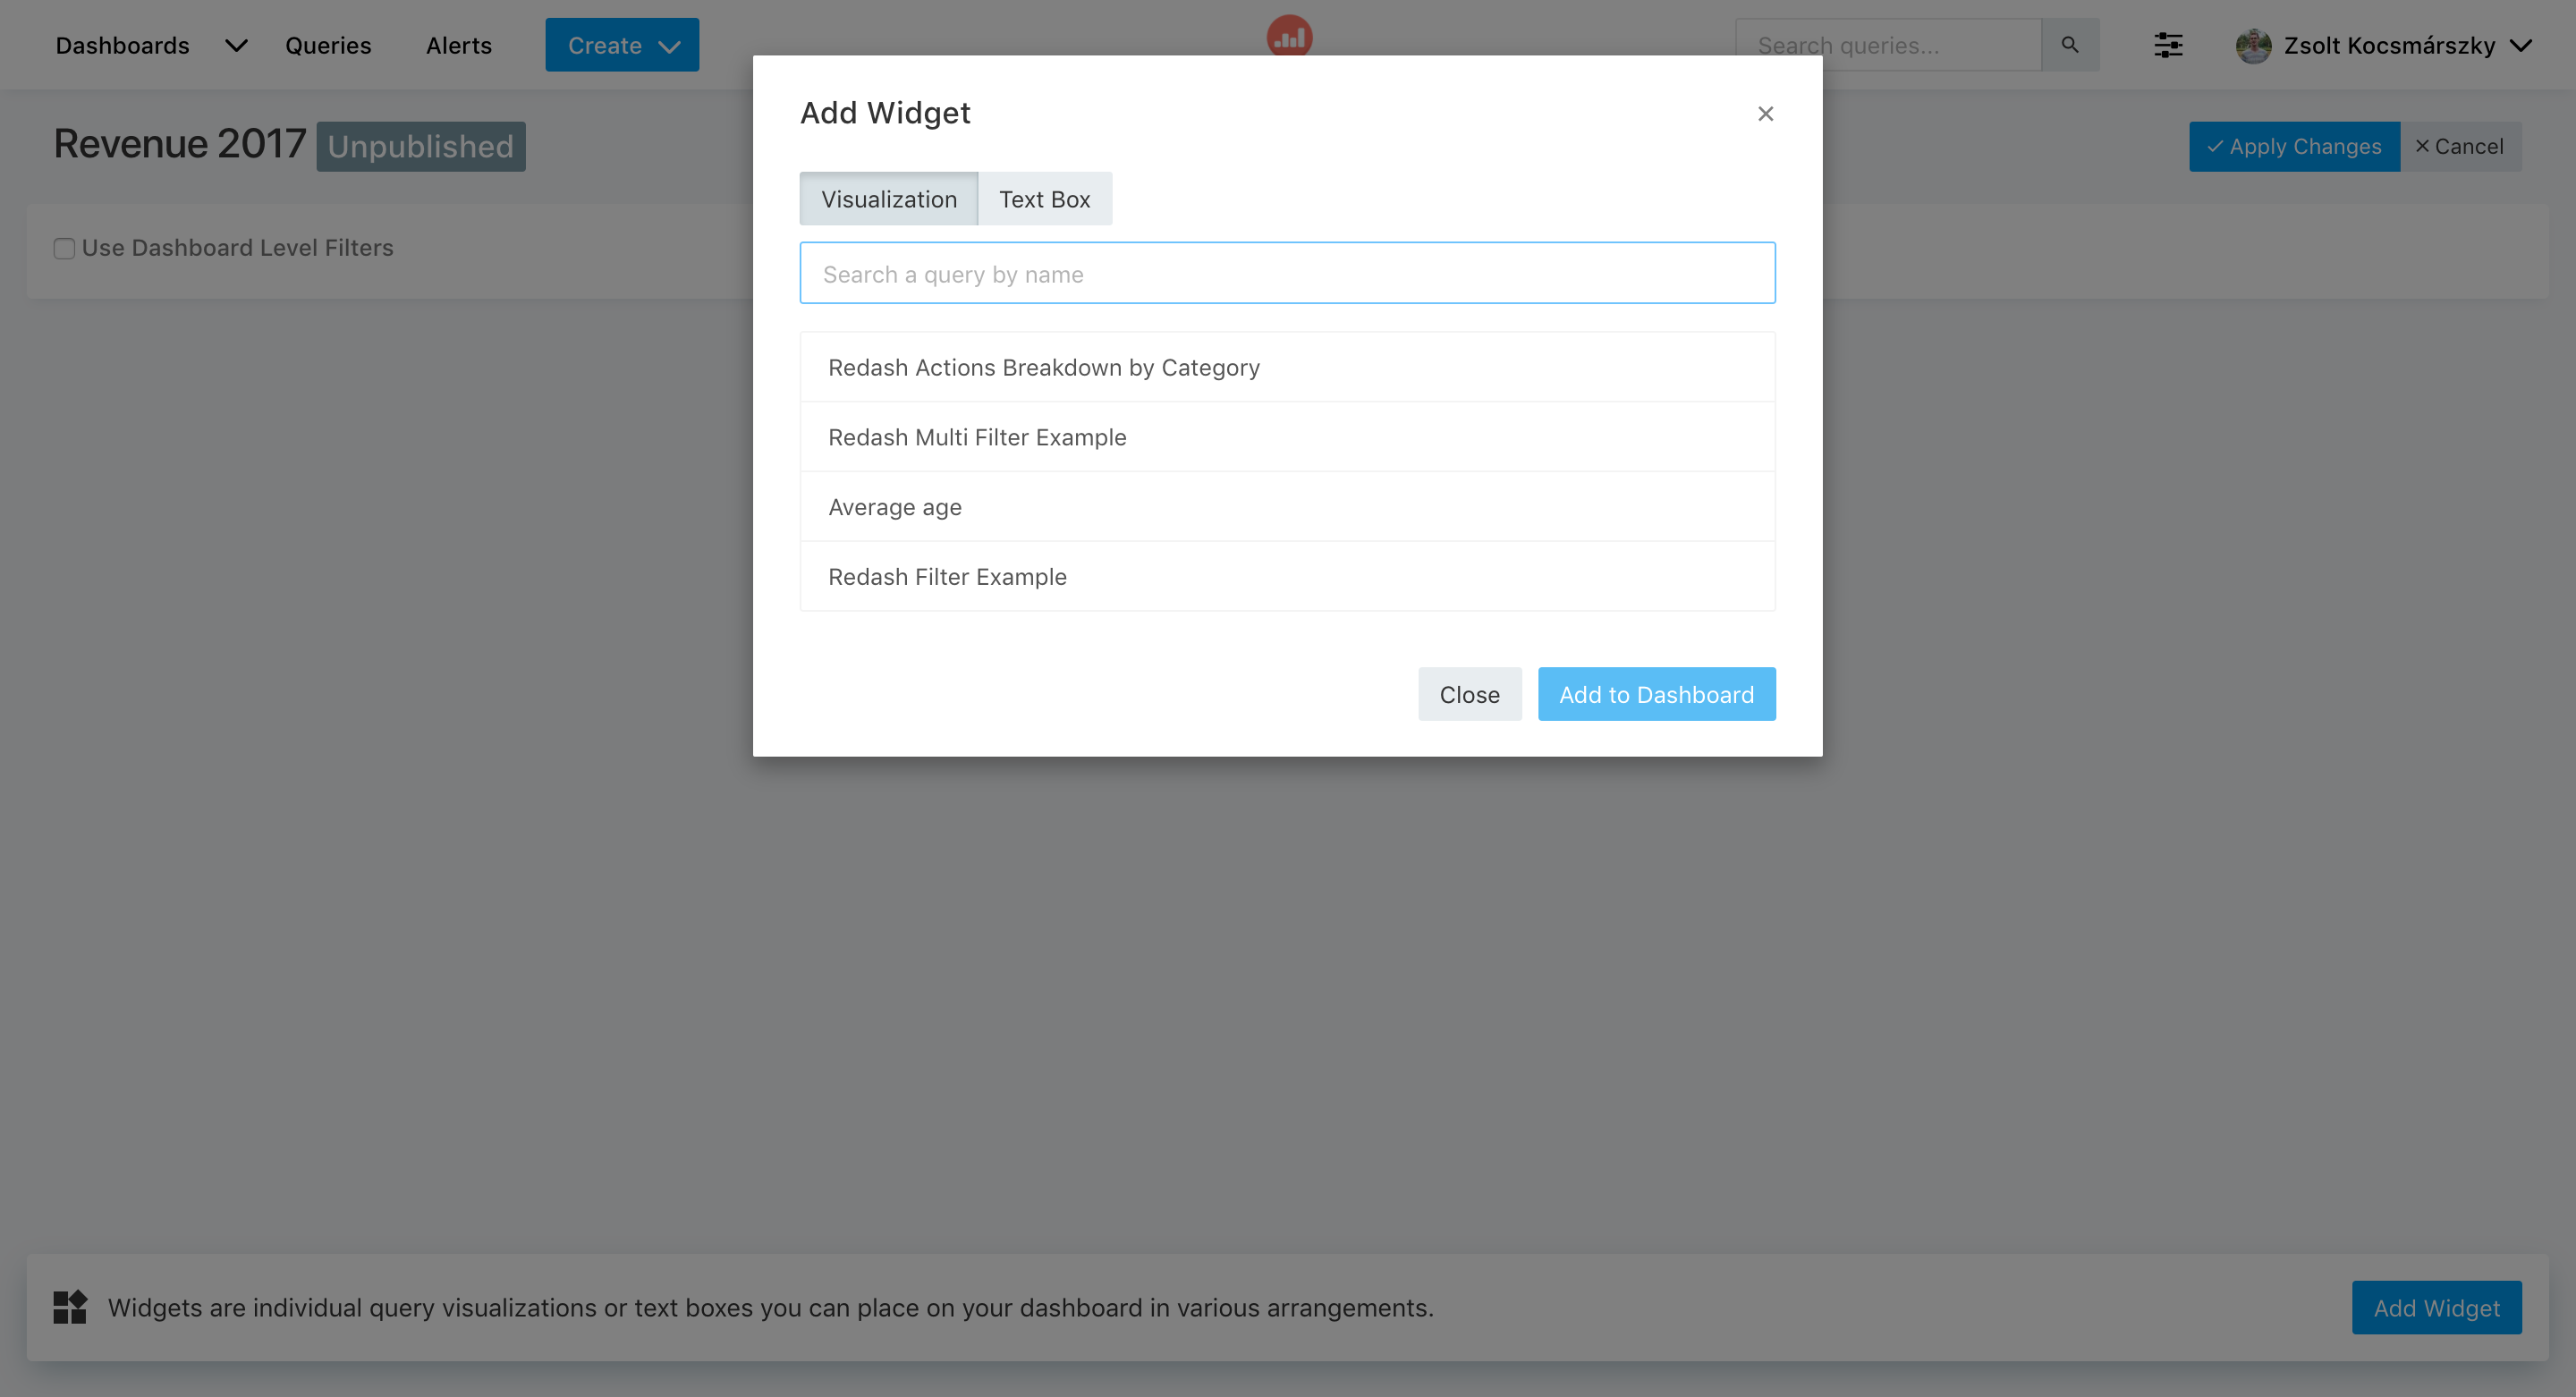
Picking Visualizations
By default, query results are shown in a table. At the moment it's not possible to create a new visualization from the "Add Widget" menu, so you'll need to open the query and add the visualization there beforehand (instructions).
Adding Text Boxes
Add a text box to your dashboard using the Text Box tab on the Add Widget dialog. You can style the text boxes in your dashboards using Markdown.
You can include static images on your dashboards within your markdown-formatted text boxes. Just use markdown image syntax:
Dashboard Filters
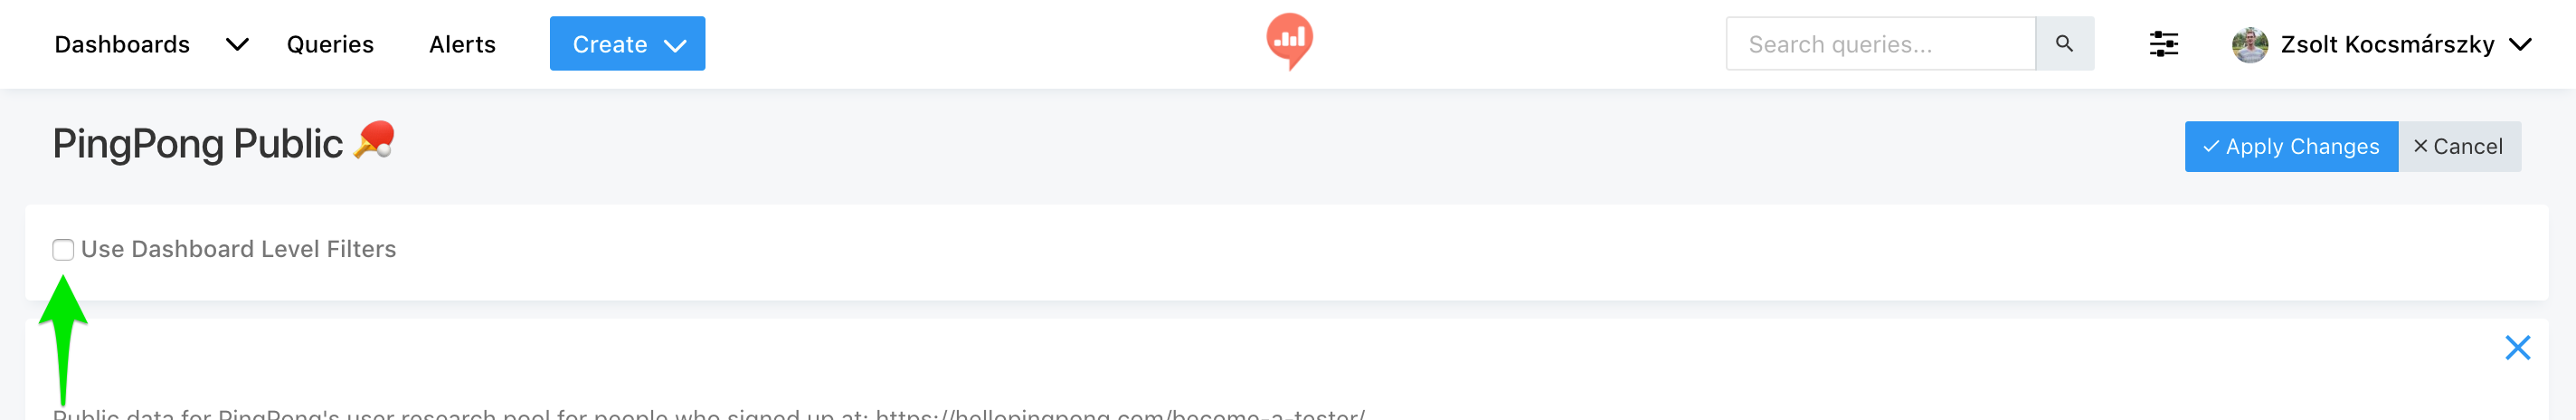
When queries have filters you need to apply filters at the dashboard level as well. Setting your dashboard filters flag will cause the filter to be applied to all Queries.
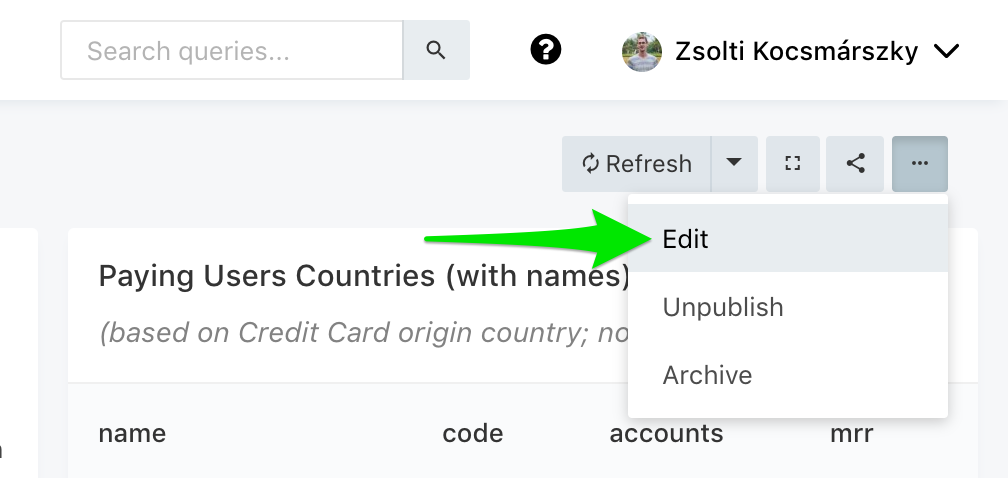
- Open dashboard settings:
- Check the "Use Dashboard Level Filters" checkbox:
Managing Dashboard Permissions
By default, dashboards can only be modified by the user who created them and members of the Admin group. But PayCore.Analytics includes experimental support to share edit permissions with non-Admin users. An Admin in your organization needs to enable it first. Open your organization settings and check the "Enable experimental multiple owners support"
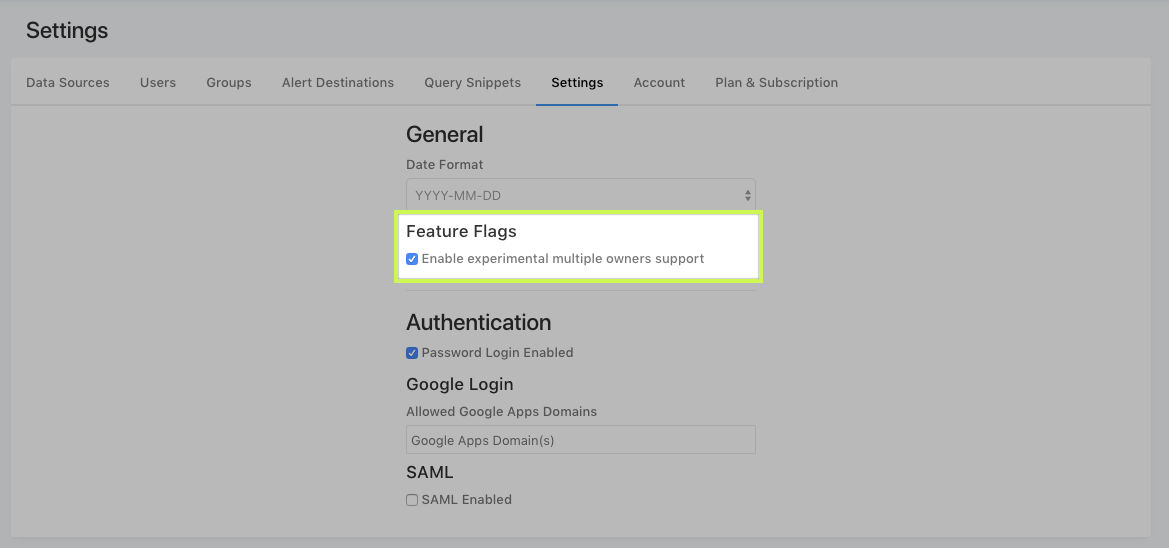
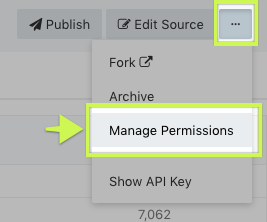
Now the Dashboard options menu includes a Manage Permissions option. Clicking on it it will open a dialog where you can add other users as editors to your dashboard.
Please note that currently the users you add won't receive a notification, so you will need to notify them manually.
Favorites & Tagging
PayCore.Analytics users write a lot of queries and dashboards! Favorites and Tagging are here to make finding them easy as your collection of queries and dashboards grows from a few hundred to a few thousand.
Favorites
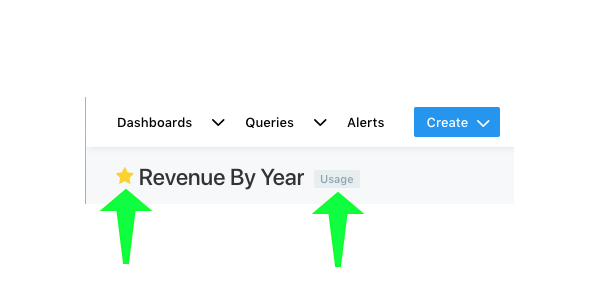
You can favorite a dashboard or query by clicking the star to the left of its title anywhere in PayCore.Analytics. The star will turn yellow to indicate success. Your favorites are displayed at several places in PayCore.Analytics. They appear on the homepage, in the navbar dropdown menus and as filters in the query or dashboard list views.
Tagging
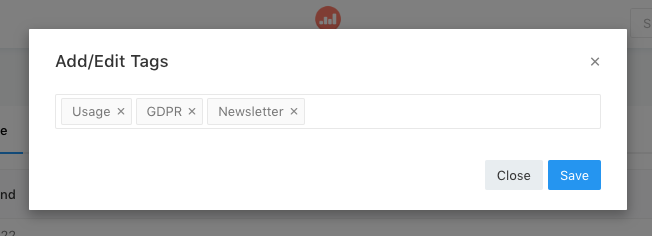
You can tag queries and queries by subject matter, location, user or any parameter that is meaningful to your organization. Tags are added from the query editor or the dashboard editor. Hover your mouse on the query or dashboard title and an +Add Tag button will appear. In the modal that appears you can select as many tags as you need. The modal will suggest previously-used tags as you type. Hit Save when you're finished or Esc to abort tagging.
It's important to have predictable taxonomy for your tags. Consistency in this area makes using PayCore.Analytics an even nicer experience and helps bring new users onboard. So we recommend that your team have an internal discussion about the tag hierarchy that will be most benefecial to your organization.
Your tags will appear on the Dashboard and Query list views on the righthand side. Click any tag to filter the list view instantly. Click a second time to remove the filter. Shift + Click to select multiple filters.
Sharing and Embedding Dashboards
PayCore.Analytics makes it easy to share your dashboards. Just click the Publish button on the upper right of the dashboard editor. Any logged-in member of your organization with adequate permissions can see your dashboard once it has been published. You can also share published dashboards with external users by clicking the share icon in the upper-right. A modal appears where you can generate a secret link to share safely outside your organization. External users can see the dashboard widgets but will not be able to navigate within the PayCore.Analytics application or view the underlying queries.
You can revoke access to a dashboard for external users by toggling Allow public access. This will break any links to this dashboard that were shared previously. If you toggle the switch again a new secret link will be generated.
Dashboard Permissions
A logged-in user will only see dashboard widgets derived from data sources to which the user has access. Users who can view a dashboard widget can also view the underlying query. Should you need to share a dashboard within your organization while also restricting access to the underlying data source, there are two options:
- Give your restricted users access using the secret link method described above
- Create a custom data source for the restricted employees and configure permissions at the database level
You can read more about PayCore.Analytics's permissions model here.
Embedding Dashboards
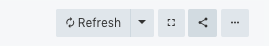
Some users embed their dashboards outside of PayCore.Analytics using iframes. PayCore.Analytics provides a Full Screenview to improve this experience. Full screen mode removes everything but the widget UI. Just click the full screen button to the right of the Refresh button. Then copy the URL from your browser into your iframe embed code. Embedding a dashboard in this way will require users to be logged-in to PayCore.Analytics. To embed PayCore.Analytics for external users you can use the secret link method described above. Secret links to PayCore.Analytics dashboards are full screen by default.